
106 CENTRAL Park #22H, New York City, NY 10019
The Private Brokerage Advantage
As an independent luxury buyer representative, Régis shares 50% of the buyer-side commission he actually receives on your purchase. Eligible buyers receive that Buyer Commission Share directly at closing to offset closing costs, down payments, or renovations. The figures beside this are illustrative, based on a 3% buyer-broker commission; your share follows the commission offered on the transaction.
Regis Roumila
Verified Member: REBNY · NAR
NYDOS LIC#: 10491211335
Property Overview
Priced to sell at less than $1,300 per sf for a coveted full-service home directly across from Central Park. All sales subject to approval by the seller.
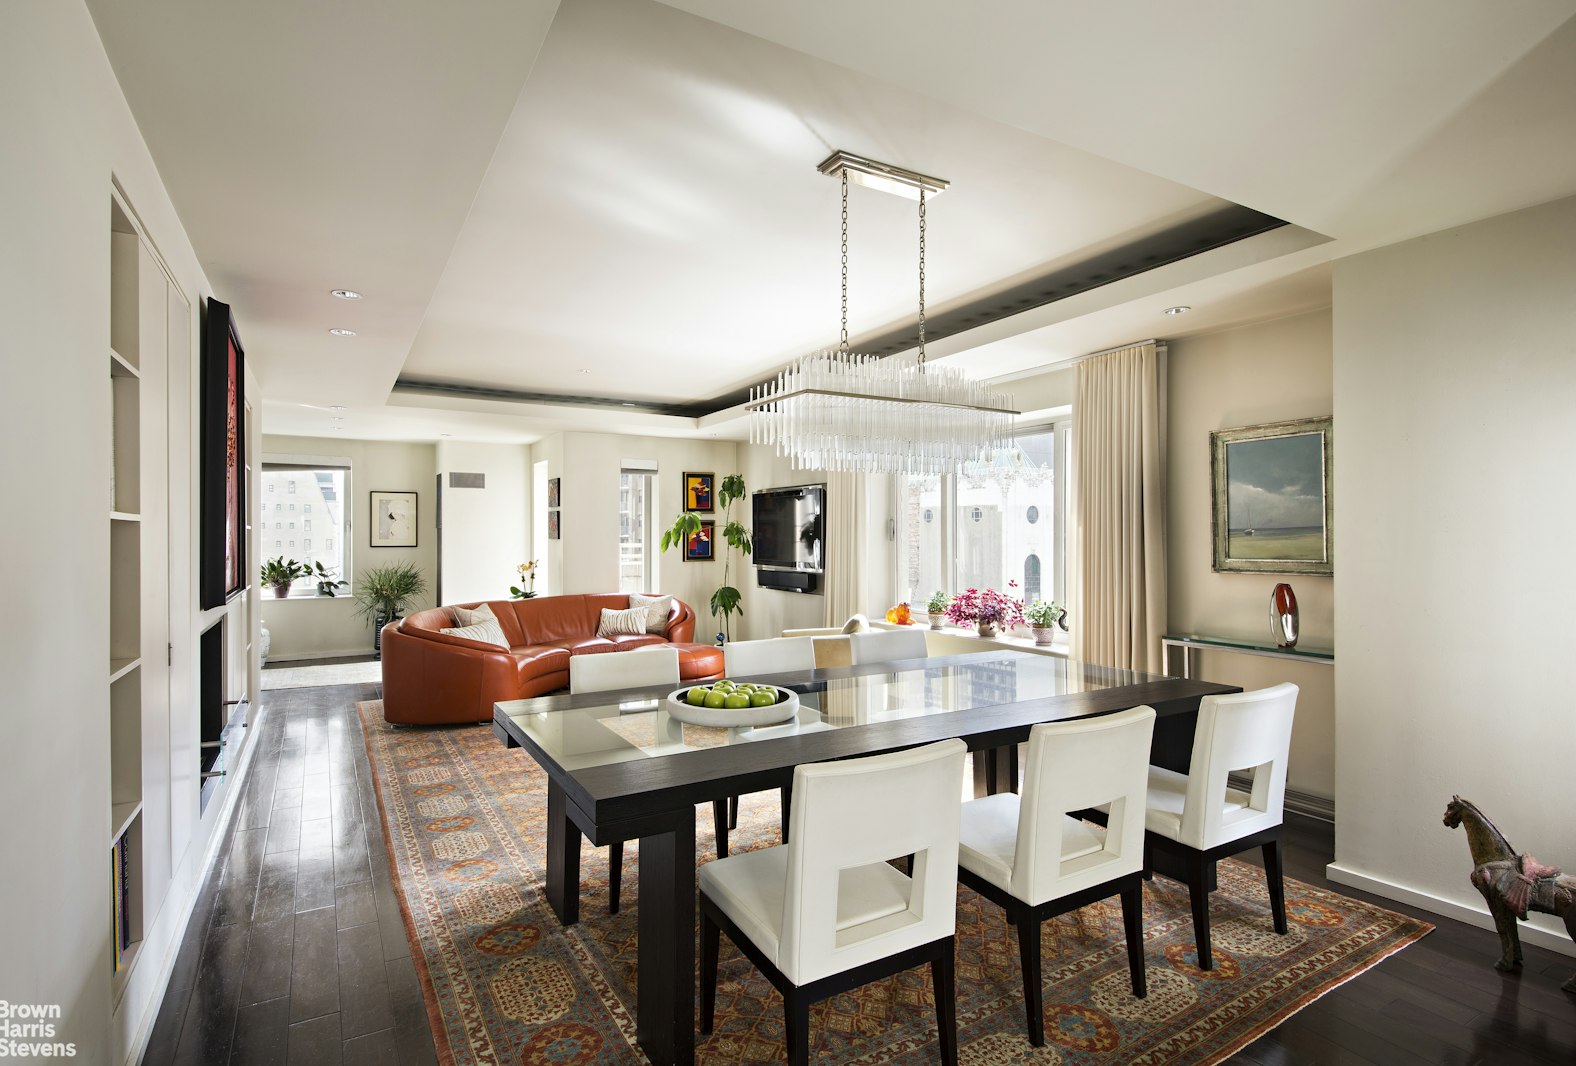
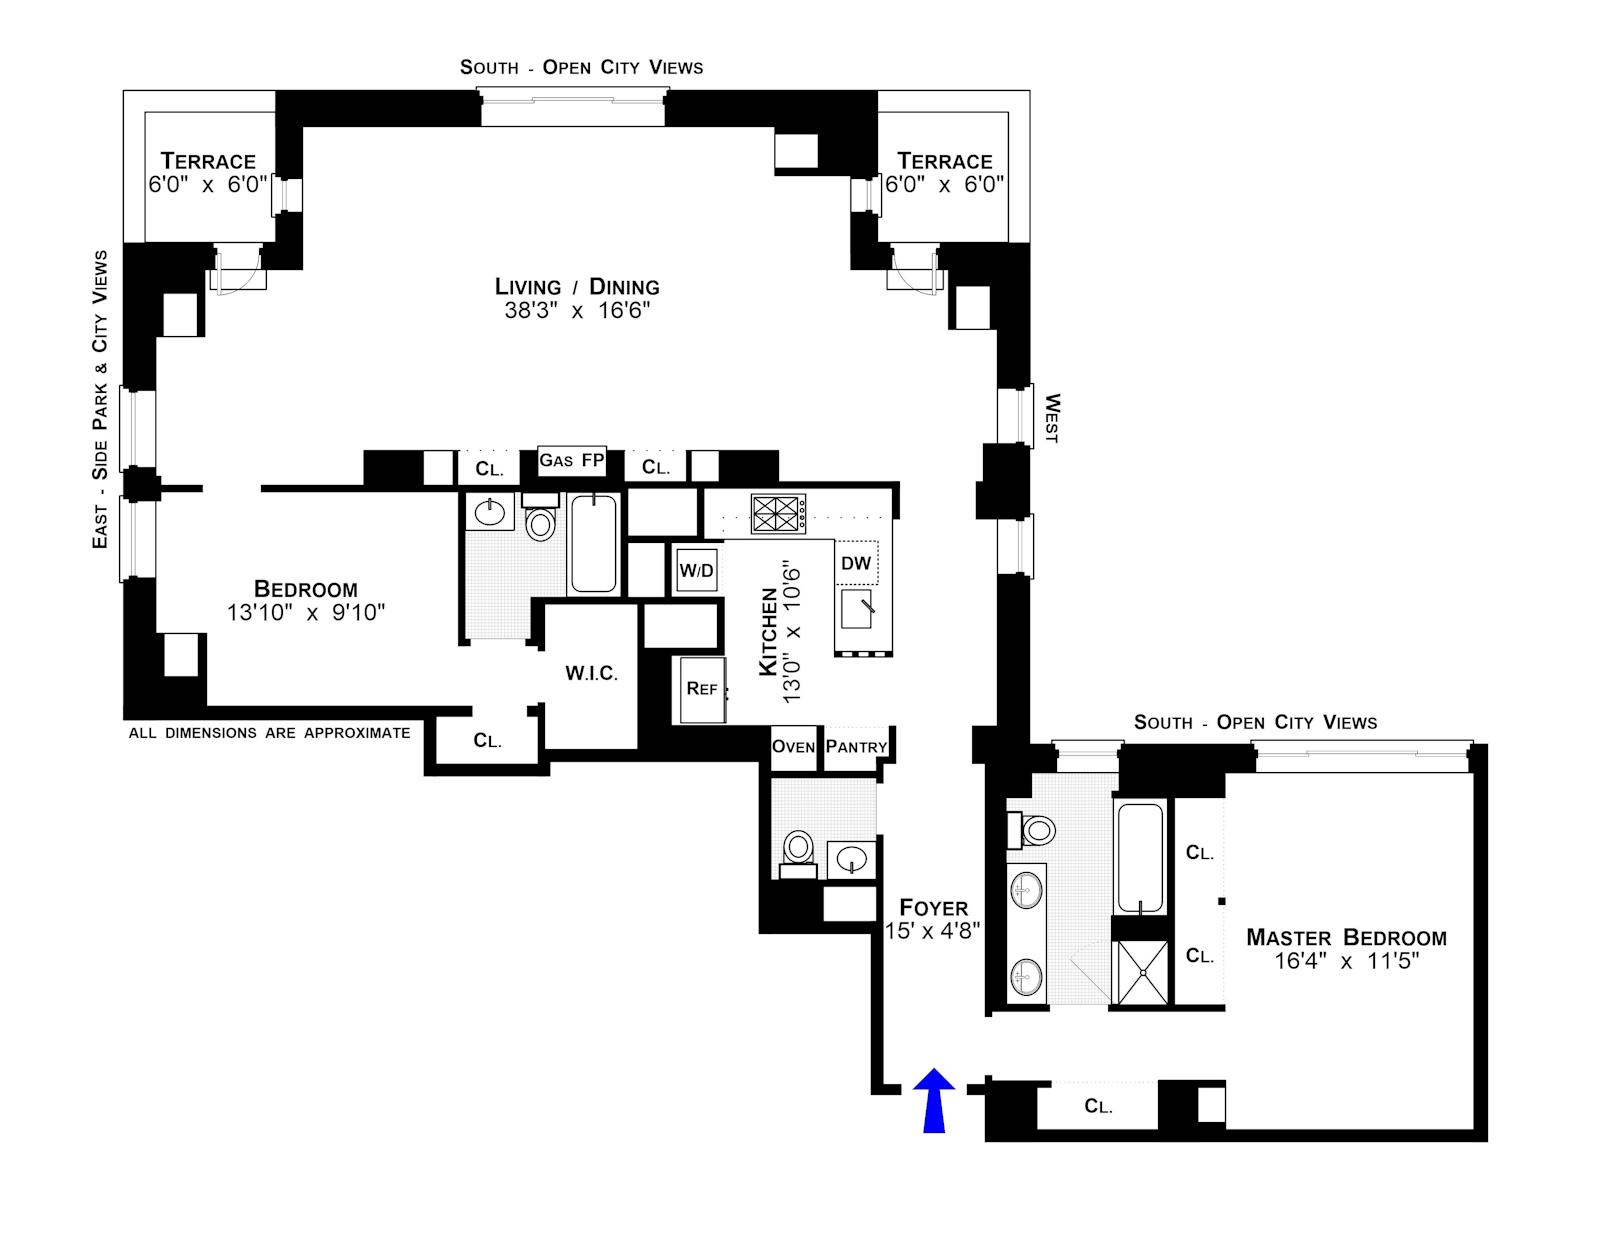
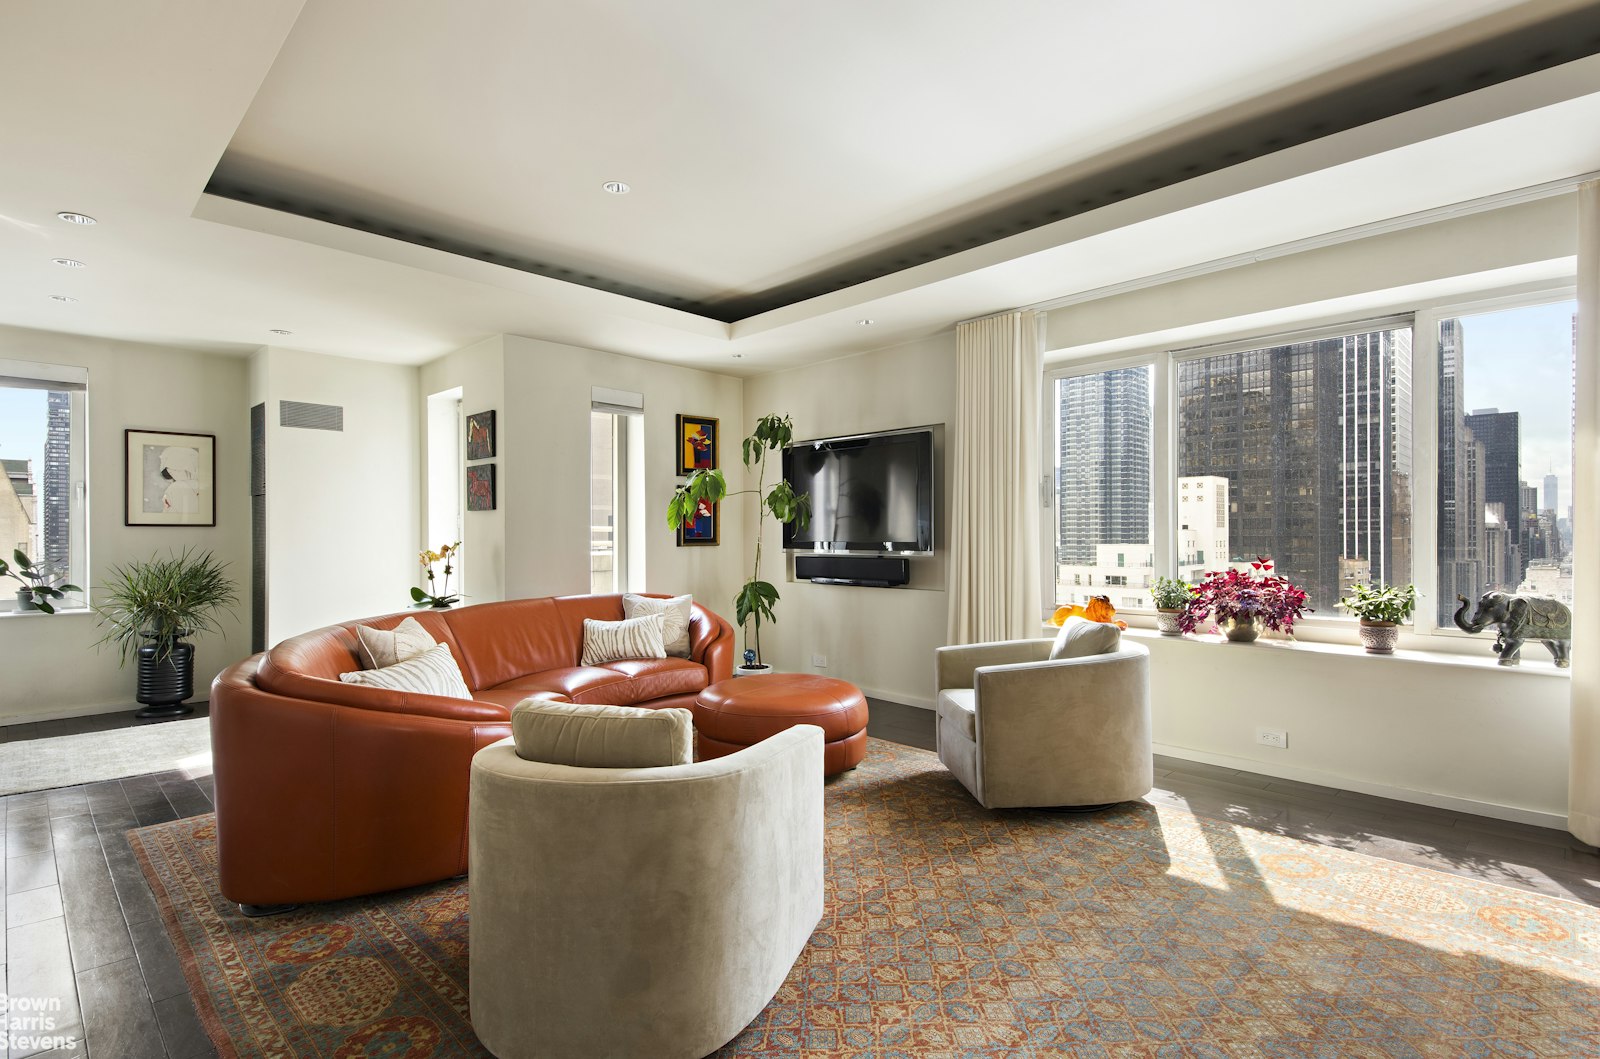
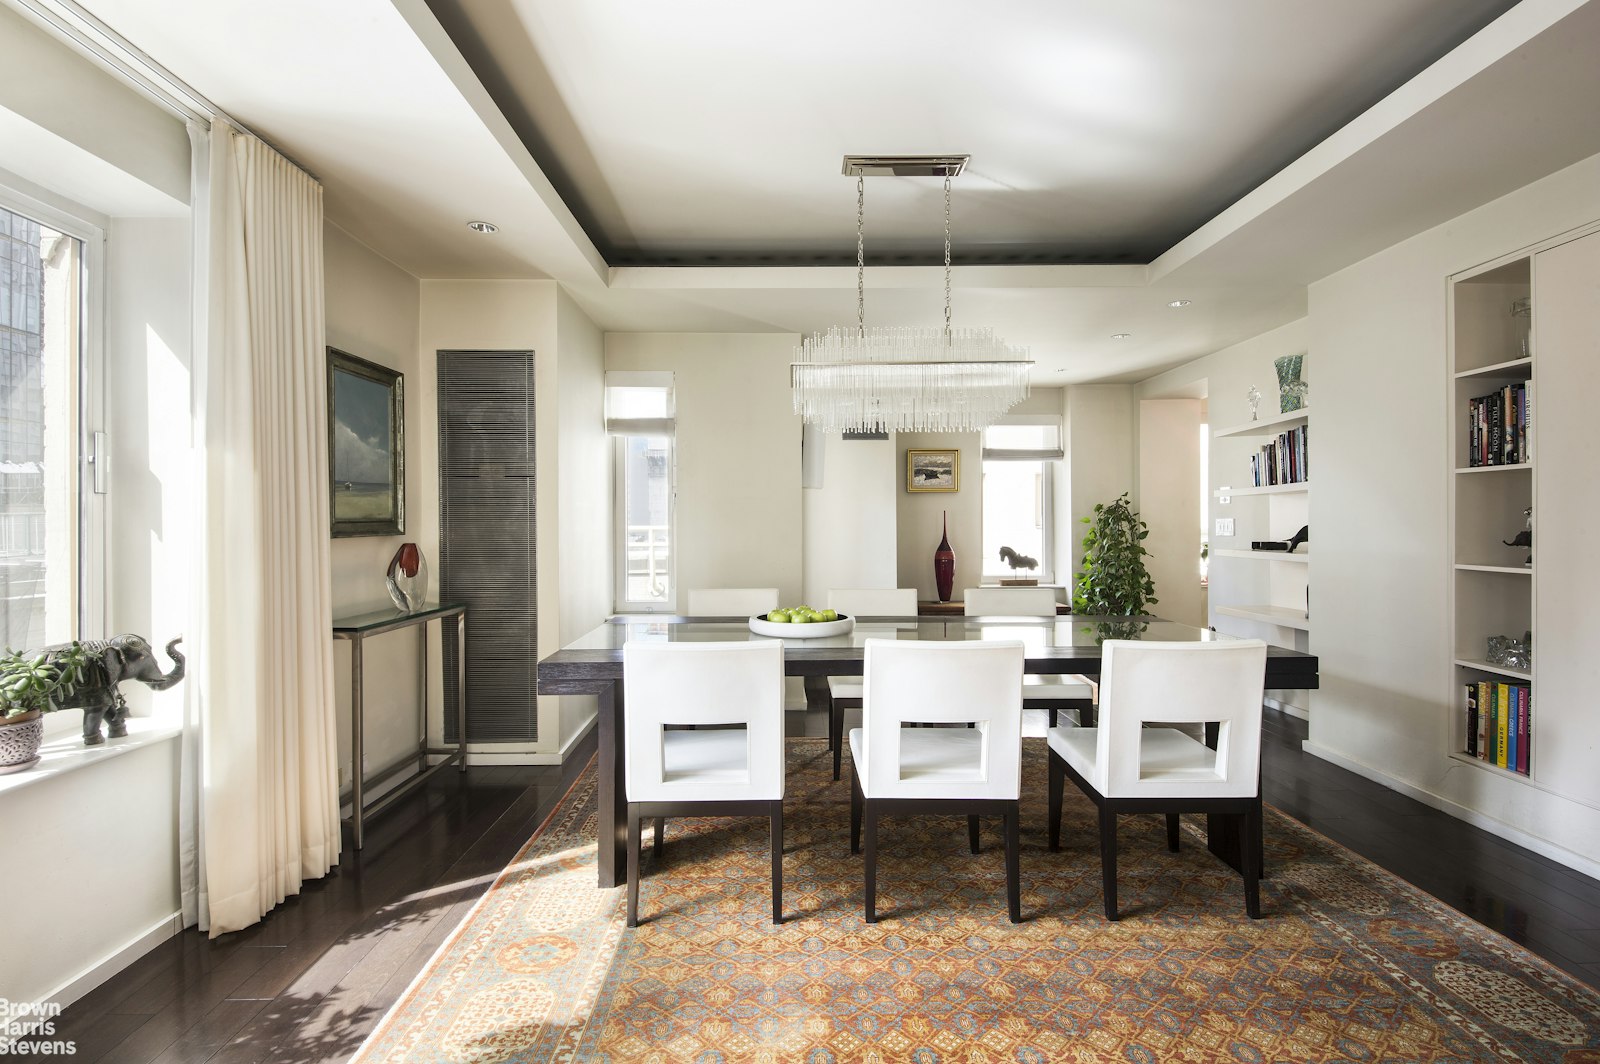
Welcome to Residence 22H at the grand and luxurious 106 Central Park South-a beautifully proportioned 2-bedroom, 2.5-bathroom home with sweeping city views and brilliant natural light from southern, eastern, and western exposures.
This spacious 1,581 Sq. Ft. residence opens with a gracious foyer, complete with a stylish powder room and a serene, tucked-away primary suite featuring...
Property Details
Residence Features
Estimated Monthly Payment
Estimates only. Actual payments may vary. Confirm terms with your lender.
Sales and market data
Recent sales
46 apartments at TRUMP PARC have recorded sales since October 2021, the most recent for $1,250,000 in September 2026. Prices are the figures recorded with the City, not asking prices.
| 22GApartment | 1 | 885 | $1,250,000 | $1,412/ft² | September 15, 2026MLS |
|---|---|---|---|---|---|
| 14GApartment | 2 | 1,157 | $2,075,000 | $1,793/ft² | July 2, 2026MLS |
| 11LMApartment | Bedroom count not recorded | 594 | $1,740,000 | $2,929/ft² | May 18, 2026City record |
| 21MNOApartment | 2 | 1,428 | $980,000 | $686/ft² | March 31, 2026MLS |
| 21M/21N/21OApartment | Bedroom count not recorded | 1,428 | $997,885 | $699/ft² | March 31, 2026City record |
| 4DApartment | Bedroom count not recorded | 600 | $600,000 | $1,000/ft² | February 26, 2026City record |
| 15AApartment | 3 | 2,835 | $5,600,000 | $1,975/ft² | November 6, 2025City record · MLS |
| 2FApartment | Studio | 553 | $649,000 | $1,174/ft² | September 29, 2025City record · MLS |
| 10I/JApartment | Bedroom count not recorded | 1,613 | $2,250,000 | $1,395/ft² | August 7, 2025City record |
| 3GApartment | Studio | 553 | $500,000 | $904/ft² | August 5, 2025City record · MLS |
| 12GApartment | 2 | 1,288 | $2,430,000 | $1,887/ft² | June 13, 2025City record · MLS |
| 2BApartment | 2 | 897 | $1,465,000 | $1,633/ft² | April 28, 2025City record · MLS |
| 25CApartment | Bedroom count not recorded | 1,039 | $1,287,000 | $1,239/ft² | April 17, 2025City record |
| 4FApartment | 1 | 770 | $995,000 | $1,292/ft² | March 5, 2025City record · MLS |
| 9GApartment | 2 | 1,230 | $1,825,000 | $1,484/ft² | January 7, 2025City record · MLS |
| 12IApartment | 2 | 1,235 | $1,840,000 | $1,490/ft² | December 31, 2024City record · MLS |
| 6EApartment | Studio | 405 | $522,000 | $1,289/ft² | May 24, 2024City record |
| 14IApartment | 2 | 1,197 | $1,900,000 | $1,587/ft² | February 15, 2024City record |
| 26DApartment | 2 | 1,605 | $3,800,000 | $2,368/ft² | February 1, 2024City record · MLS |
| 15OApartment | Studio | 400 | $725,000 | $1,813/ft² | January 18, 2024City record · MLS |
| 3AApartment | 3 | 3,104 | $6,250,000 | $2,014/ft² | December 1, 2023City record · MLS |
| 23CApartment | 2 | 1,352 | $2,385,000 | $1,764/ft² | October 17, 2023City record · MLS |
| 2HApartment | 1 | 928 | $1,050,000 | $1,131/ft² | September 14, 2023City record · MLS |
| 8LApartment | 1 | 597 | $750,000 | $1,256/ft² | July 25, 2023City record · MLS |
| 7EApartment | Studio | 405 | $500,000 | $1,235/ft² | June 15, 2023City record |
| 23IApartment | 1 | 1,062 | $1,350,000 | $1,271/ft² | May 22, 2023City record · MLS |
| 20EApartment | Studio | 405 | $660,000 | $1,630/ft² | May 17, 2023City record |
| 8IApartment | Bedroom count not recorded | 1,197 | $1,525,000 | $1,274/ft² | March 28, 2023City record |
| 34BApartment | 2 | 1,468 | $2,850,000 | $1,941/ft² | November 7, 2022City record · MLS |
| 3AApartment | 3 | 3,104 | $6,850,000 | $2,207/ft² | November 4, 2022City record · MLS |
| 8EApartment | Studio | 405 | $643,000 | $1,588/ft² | November 1, 2022City record |
| 15CApartment | Studio | 500 | $652,500 | $1,305/ft² | September 21, 2022City record · MLS |
| 11HApartment | Bedroom count not recorded | 658 | $1,100,000 | $1,672/ft² | September 19, 2022City record |
| 19OApartment | Studio | 400 | $625,000 | $1,563/ft² | September 19, 2022City record · MLS |
| 26AApartment | 3 | 2,450 | $6,300,000 | $2,571/ft² | August 18, 2022City record · MLS |
| 12JApartment | Bedroom count not recorded | 399 | $550,000 | $1,378/ft² | June 14, 2022City record |
| 12GApartment | 2 | 1,275 | $1,595,000 | $1,251/ft² | May 25, 2022City record · MLS |
| 23HApartment | 1 | 1,056 | $1,510,000 | $1,430/ft² | May 13, 2022City record · MLS |
| 2EApartment | Studio | 573 | $650,000 | $1,134/ft² | May 10, 2022City record · MLS |
| 9NApartment | Studio | 513 | $660,000 | $1,287/ft² | March 9, 2022City record · MLS |
Showing the 40 most recent of 46 recorded sales in this period.
Every row is a recorded transaction, including ancillary spaces such as storage and staff rooms where they were sold separately. Those are excluded from the benchmark below.
How this price compares
- This home
- $2,000,000
- Median sold price
- $1,840,000
- Difference
- +$160,000 (+8.7%)
- This home, $/ft²
- $1,265
- Median $/ft²
- $1,587
- Comparable sales
- 11
- Sales from
- Oct 2021 – Jun 2025
Based on two-bedroom sales at TRUMP PARC.
More market data
- Middle half of those sales
- $1,636,500 – $2,407,500
How these sales were negotiated
- Sale-to-list price
- 91.7%
- Sold below asking
- 100%
- Typical time to find a buyer
- 118 days
- Typical time to close
- 59 days
Based on two-bedroom sales at TRUMP PARC with the required listing and closing data. Sample sizes vary by metric.
Price trend
Median price per square foot, sales at TRUMP PARC
| Year | Median $/ft² | Sales |
|---|---|---|
| 2022 | $1,393/ft² | 16 |
| 2023 | $1,273/ft² | 8 |
| 2024 | $1,587/ft² | 5 |
| 2025 | $1,395/ft² | 9 |
| 2026 YTD | $1,000/ft² | 3Thin |
More market history
| Year | Median $/ft² | Sales |
|---|---|---|
| 2016 | $1,799/ft² | 3Thin |
| 2017 | $1,824/ft² | 13 |
| 2018 | $1,543/ft² | 11 |
| 2019 | $1,405/ft² | 12 |
| 2020 | $1,340/ft² | 7 |
| 2021 | $1,250/ft² | 9 |
Based on recorded sales at TRUMP PARC. 2026 is year-to-date.
Years marked "thin" rest on fewer than 5 sales, where a single unusual apartment moves the median a long way. Read those points as the small samples they are rather than as the market turning.
Sales data through September 2026.
Sale prices and dates are based on NYC ACRIS records. MLS closing dates may differ. Historical sales are not an appraisal or valuation of this property.
Price and Property History for 106 CENTRAL Park, Unit 22H
Review the recorded listing activity for 106 CENTRAL Park, Unit 22H, including asking-price changes and prior market dates.
- Latest price change
- Reduced by $950,000, or 32.2%, on April 14, 2026
- Originally listed
- April 23, 2025 at $3,295,000
- Entered contract
- May 5, 2026
| Date | Price | Listing event |
|---|---|---|
| $2,000,000 | Entered contract | |
| $2,000,000 | Asking price reduced by $950,000, or 32.2% | |
| $2,000,000 | Returned to the market | |
| $3,295,000 | Listed for sale by Brown Harris Stevens Residential Sales LLC |
Property Tax History
Taxes at 106 CENTRAL Park #22H were $26,210 in 2026, up 3.7% from 2025.
| Year | Tax Assessment | Land | Additions | Billable Value | Property Tax | Tax Rate |
|---|---|---|---|---|---|---|
| 2026FY 2026/27 | $224,261 | $43,897 | $180,364 | $209,682 | $26,210 | 12.5%Estimated |
| 2025FY 2025/26 | $211,661 | $43,897 | $167,764 | $202,281 | $25,285 | 12.5%Estimated |
| 2024FY 2024/25 | $212,044 | $43,897 | $168,147 | $202,361 | $25,295 | 12.5% |
| 2023FY 2023/24 | $209,194 | $43,897 | $165,297 | $201,833 | $25,233 | 12.502% |
| 2022FY 2022/23 | $191,258 | $43,897 | $147,361 | $191,258 | $19,367after $4,095 abatement | 12.267% |
| 2021FY 2021/22 | $187,254 | $43,897 | $143,357 | $187,254 | $6,853after $16,058 abatement | 12.235% |
| 2020FY 2020/21 | $212,061 | $43,897 | $168,164 | $196,331 | $24,084 | 12.267% |
| 2019FY 2019/20 | $209,410 | $43,897 | $165,513 | $189,321 | $23,614 | 12.473% |
| 2018FY 2018/19 | $186,120 | $43,896 | $142,224 | $180,239 | $22,732 | 12.612% |
| 2017FY 2017/18 | $186,580 | $43,896 | $142,684 | $173,998 | $22,131 | 12.719% |
| 2016FY 2016/17 | $187,486 | $43,896 | $143,590 | $165,356 | $21,318 | 12.892% |
| 2015FY 2015/16 | $177,019 | $43,897 | $133,122 | $156,852 | $20,207 | 12.883% |
| 2014FY 2014/15 | $164,014 | $43,896 | $120,118 | $147,803 | $19,000 | 12.855% |
| 2013FY 2013/14 | $154,914 | $43,897 | $111,017 | $141,911 | $18,654 | 13.145% |
| 2012FY 2012/13 | $143,364 | $43,897 | $99,467 | $147,328 | $19,419 | 13.181% |
| 2011FY 2011/12 | $144,958 | $67,863 | $77,095 | $153,482 | $20,617 | 13.433% |
| 2010FY 2010/11 | $131,780 | $67,863 | $63,917 | $155,175 | $20,721 | 13.353% |
The City has not published the official FY2026/27 and FY2025/26 tax rates yet. We calculated the tax for those years using the prior year’s rate, so treat them as an estimate rather than a figure the City has adopted. Every rate without the Estimated marker is the published one.
Tax Assessment is the assessed value on the City’s roll, and it is the figure other listing sites publish. It is not what the bill is calculated on. New York phases assessment changes in gradually for some tax classes, so the City bills the Billable Value shown beside it, less any exemption the owner holds. It usually trails the assessment, and it can sit above it for a few years after an assessment falls.
Where an abatement applies, Property Tax is the amount owed after it. Abatements are granted to the property and do not necessarily transfer to a new owner.
Figures are the New York City Department of Finance assessment roll for tax lot 1010114356. Assessed and billable values are determined by the City for tax purposes and are not an appraisal or an estimate of market value. Tax classes and rates are set annually and can change.
About The Building
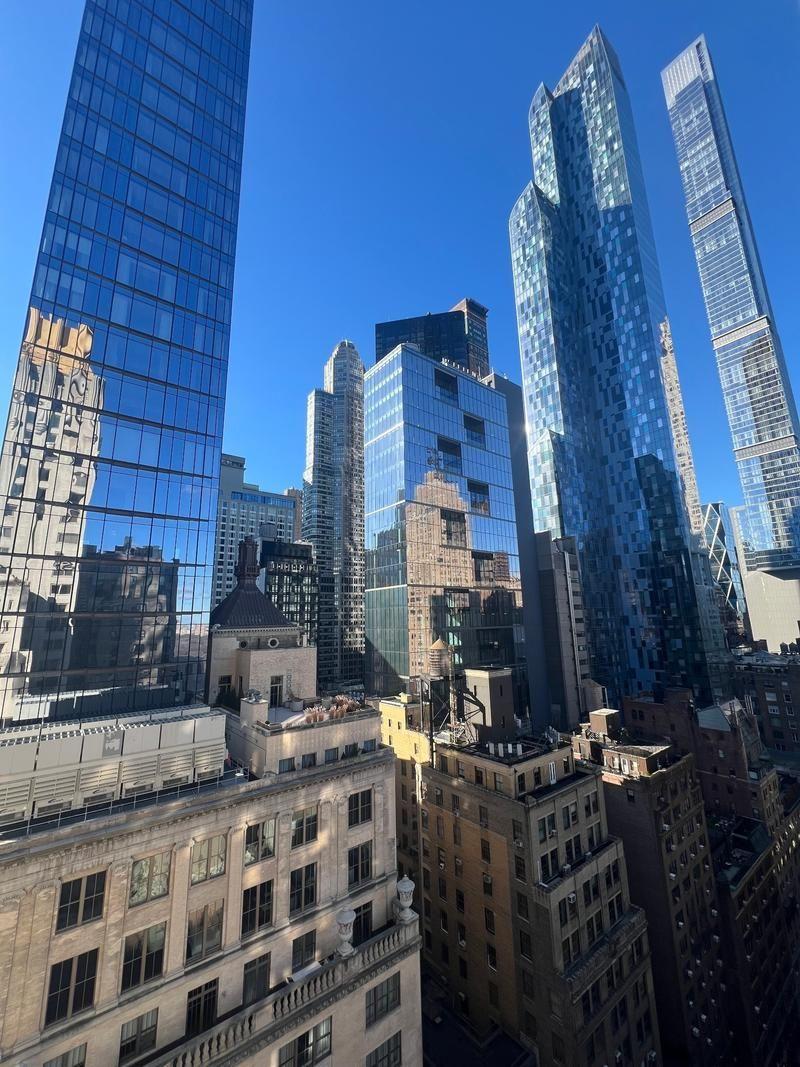
TRUMP PARC
106 CENTRAL Park, New York, NY 10019
A building in Central Park South, currently featuring 13 active listings.
Interested in TRUMP PARC?
Consult Régis for private buyer guidance, off-market opportunities, building financials, board package requirements, closing costs, and potential Buyer Savings.
Available Residences
| 22H | 2 | 3 | 1,581 sqft | $1,265 | $2,000,000(-32.2%) In contract | Nov 18, 2025 | 328 days | |
| 7O | Studio | 1 | 636 sqft | $1,281 | $815,000(-1.2%) | Jun 3, 2026 | 131 days | |
| 21ABCDE | 4 | 5 | 5,450 sqft | $2,385 | $13,000,000(-15.7%) | Mar 27, 2026 | 199 days | |
| 14B | 1 | 2 | 787 sqft | $1,874 | $1,475,000(-1.6%) | May 8, 2026 | 157 days | |
| 15O | Studio | 1 | 400 sqft | $1,863 | $745,000(-0.7%) | Jul 8, 2026 | 96 days | |
| 10H | 1 | 2 | 666 sqft | $1,652 | $1,100,000(-8.3%) | Jul 28, 2026 | 76 days |
In the Neighborhood
Nearby Schools
* Distances are approximate line-of-sight metrics.
Map
Central Park South
Overview of Central Park South
Central Park South encompasses the three blocks of 59th Street between Columbus Circle and Fifth Avenue. It is one of the most famous streets in the world, framing the southern edge of the park. For buyers considering Central Park South Manhattan real estate, this is purchasing a piece of a global postcard. Living in Central Park South, Manhattan is about views and prestige. The street is lined with historic luxury hotels (like the Plaza) and high-end residential towers. As an exclusive Manhattan NYC neighborhood, it offers a front-row seat to the changing seasons of Central Park and the luxury shopping of Fifth Avenue.Real Estate & Housing Market
The homes for sale in Central Park South are trophy assets. Inventory consists of white-glove co-ops, hotel-condos (where you can live in the Plaza or the Ritz-Carlton), and historic apartments. Prices are premium, largely dictated by the view: a direct park view commands one of the highest price-per-square-foot premiums in the city. This market attracts international billionaires, celebrities, and investors. Owning here is a statement. The properties often function as luxurious pied-à-terres with full hotel services, including room service and housekeeping.Lifestyle & Community
The lifestyle in Central Park South is luxurious and service-oriented. Residents live above the city, often literally. It is not a traditional "neighborhood" with a local butcher; rather, your amenities are the Palm Court, Bergdorf Goodman, and the park itself. Community here is found in the exclusivity of the buildings. It is quiet at night once the tourists disperse, and the proximity to Lincoln Center and Broadway makes it a cultural haven. It is living in the center of the world's luxury map.Transportation & Accessibility
Central Park South is incredibly well-connected. Columbus Circle (1, A, B, C, D) and the N, R, W at 5th Avenue provide instant subway access. You are steps from the crosstown buses and the carriage rides of the park. The location is pivotal—midway between the West Side and East Side. You can walk to a Broadway show, a Carnegie Hall concert, or a business meeting in Midtown with equal ease.Parks, Schools & Amenities
The neighborhood's name says it all: Central Park is your front lawn. Residents have immediate access to the Pond, the Zoo, and the main drives. It is the ultimate amenity. Amenities are hotel-grade. Many buildings offer spas, gyms, and dining services. Shopping is world-class, with the Shops at Columbus Circle (featuring a Whole Foods) and the luxury boutiques of 57th Street (Billionaire's Row) just a block away.Who This Neighborhood Is Best For
Central Park South is best for ultra-wealthy buyers, international investors, and those seeking a prestigious pied-à-terre with hotel services and iconic park views.
RLS IDX Data display by Real Estate Rebate Team. This information is not verified for authenticity or accuracy and is not guaranteed and may not reflect all real estate activity in the market. ©2026 The Real Estate Board of New York, Inc., All rights reserved. IDX information is provided exclusively for consumers’ personal, non-commercial use and it may not be used for any purpose other than to identify prospective properties consumers may be interested in purchasing.
All information furnished regarding property for sale, rental or financing is from sources deemed reliable, but no warranty or representation is made as to the accuracy thereof and same is submitted subject to errors, omissions, change of price, rental or other conditions, prior sale, lease or financing or withdrawal without notice. All dimensions are approximate. For exact dimensions, you must hire your own architect or engineer and the number of bedrooms listed is for informational purposes and is not a legal conclusion. Please consult with your own architect or engineer for exact dimensions and legal specifications.