
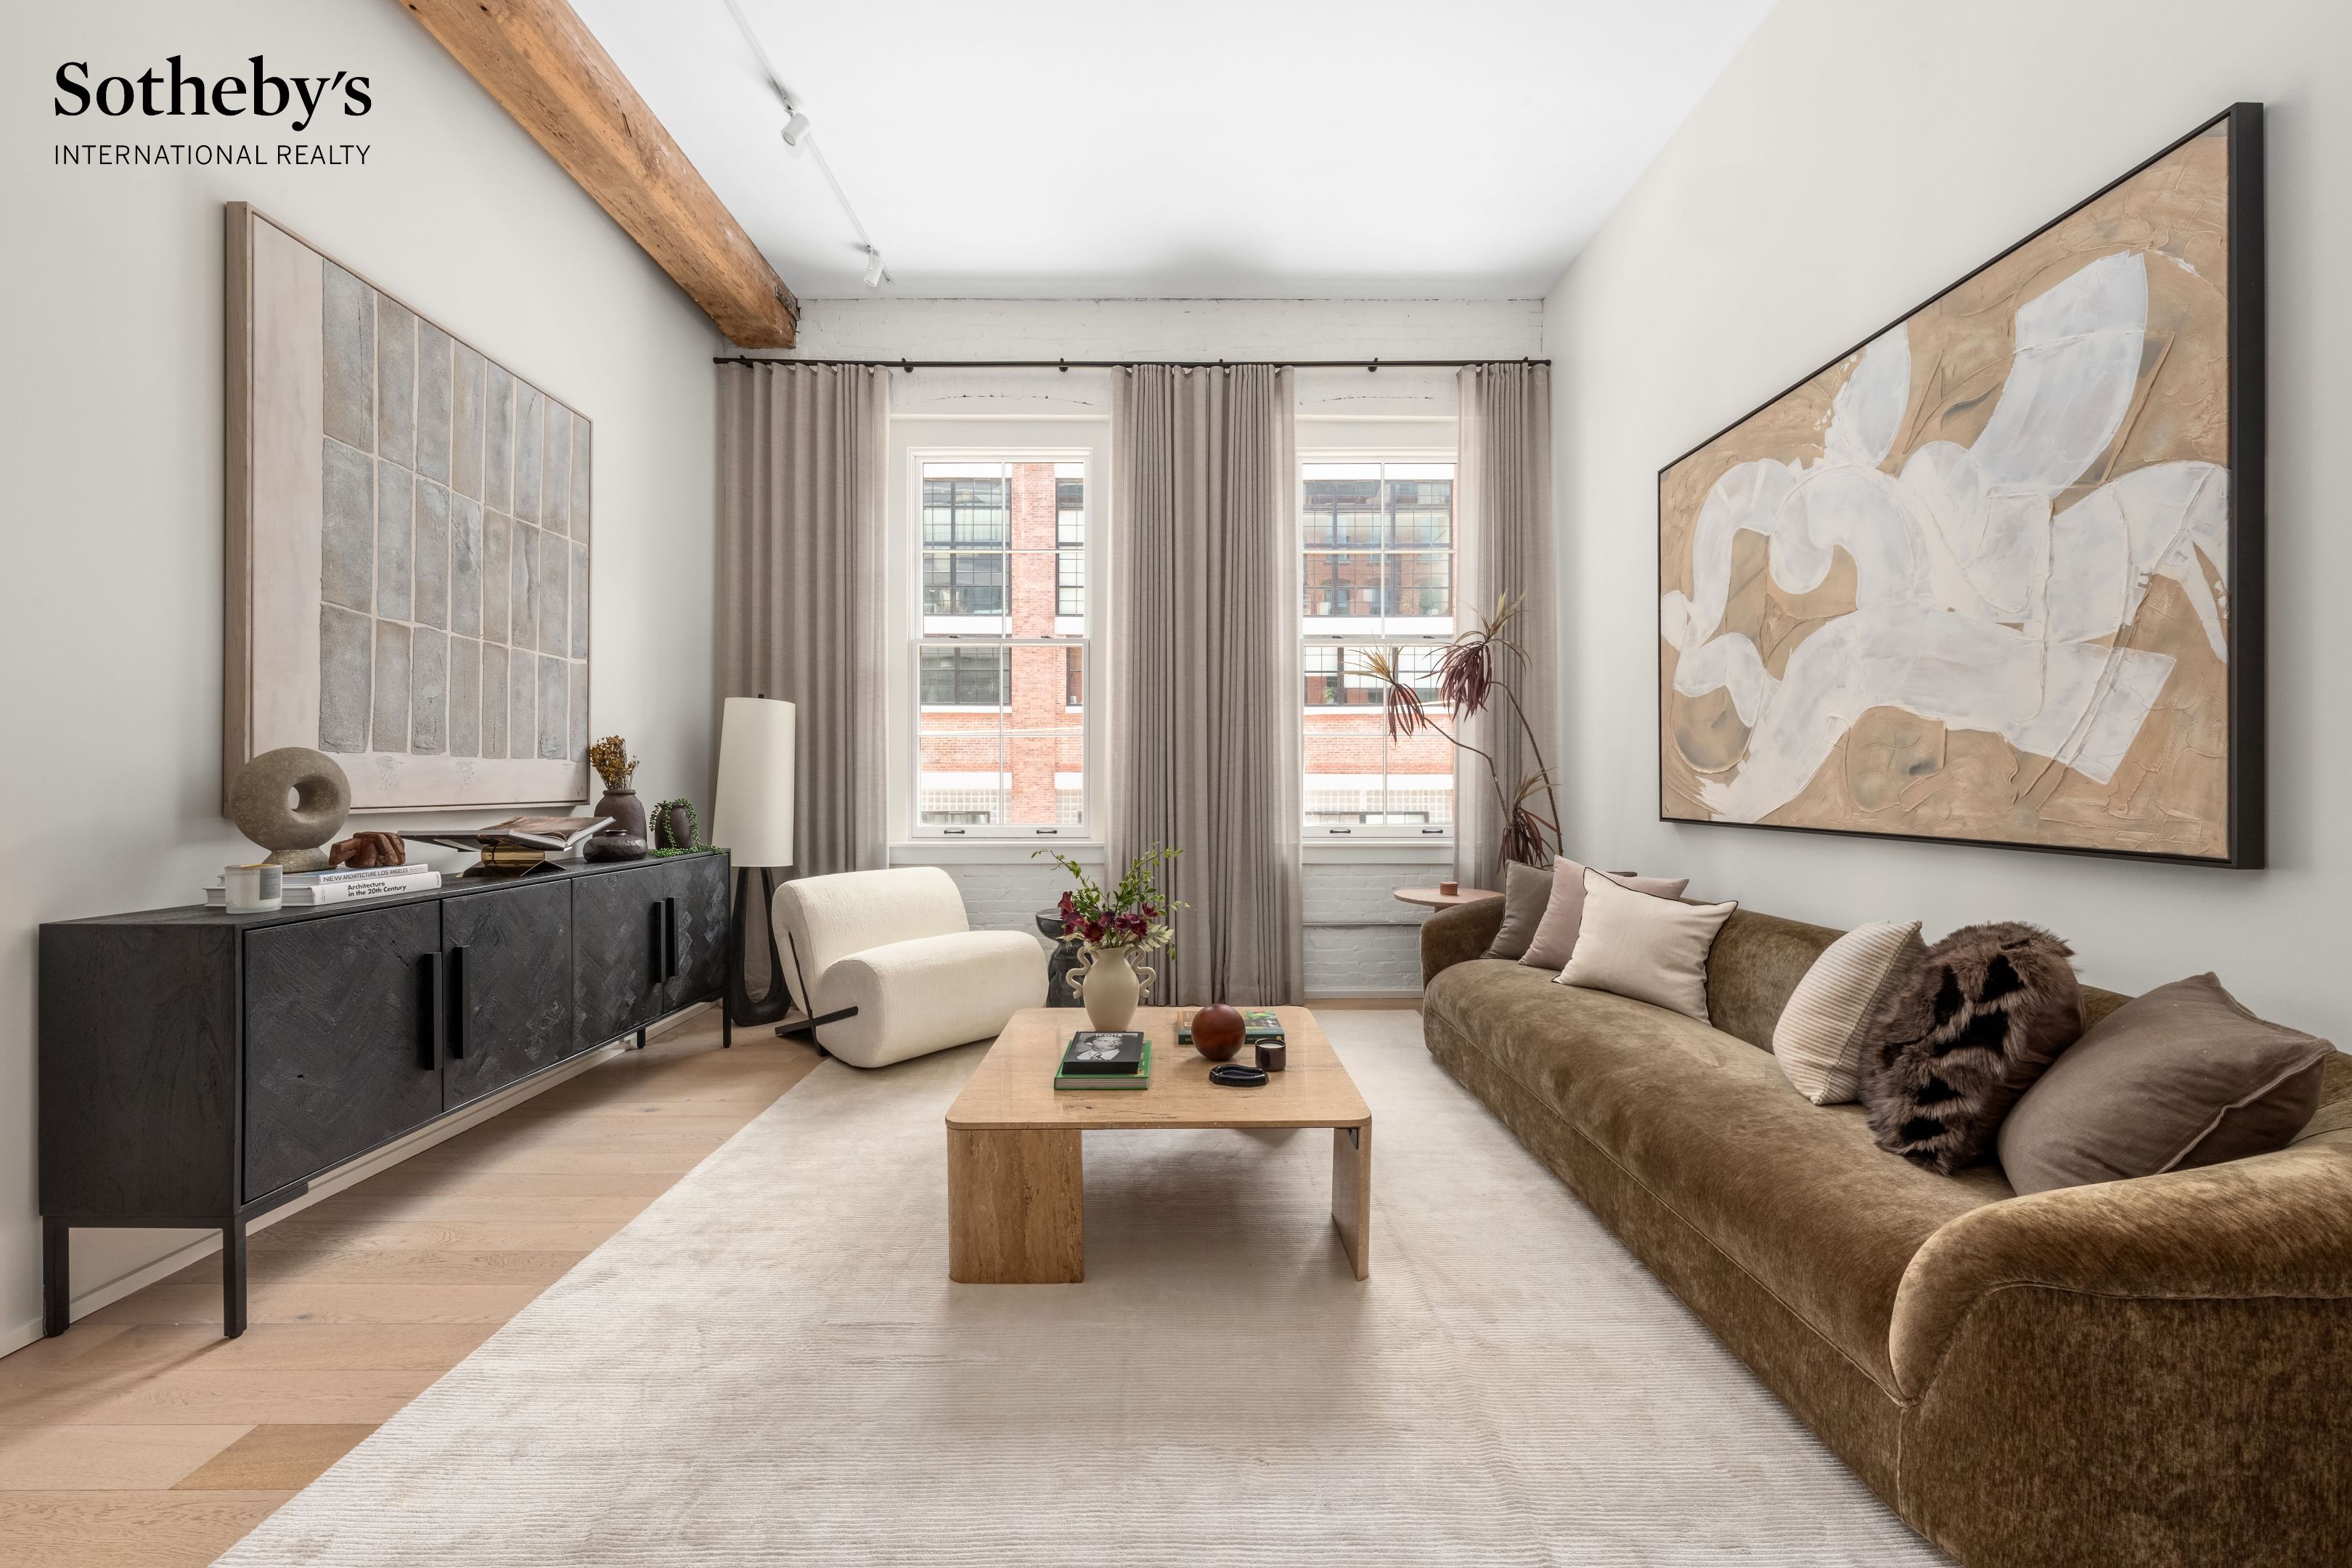
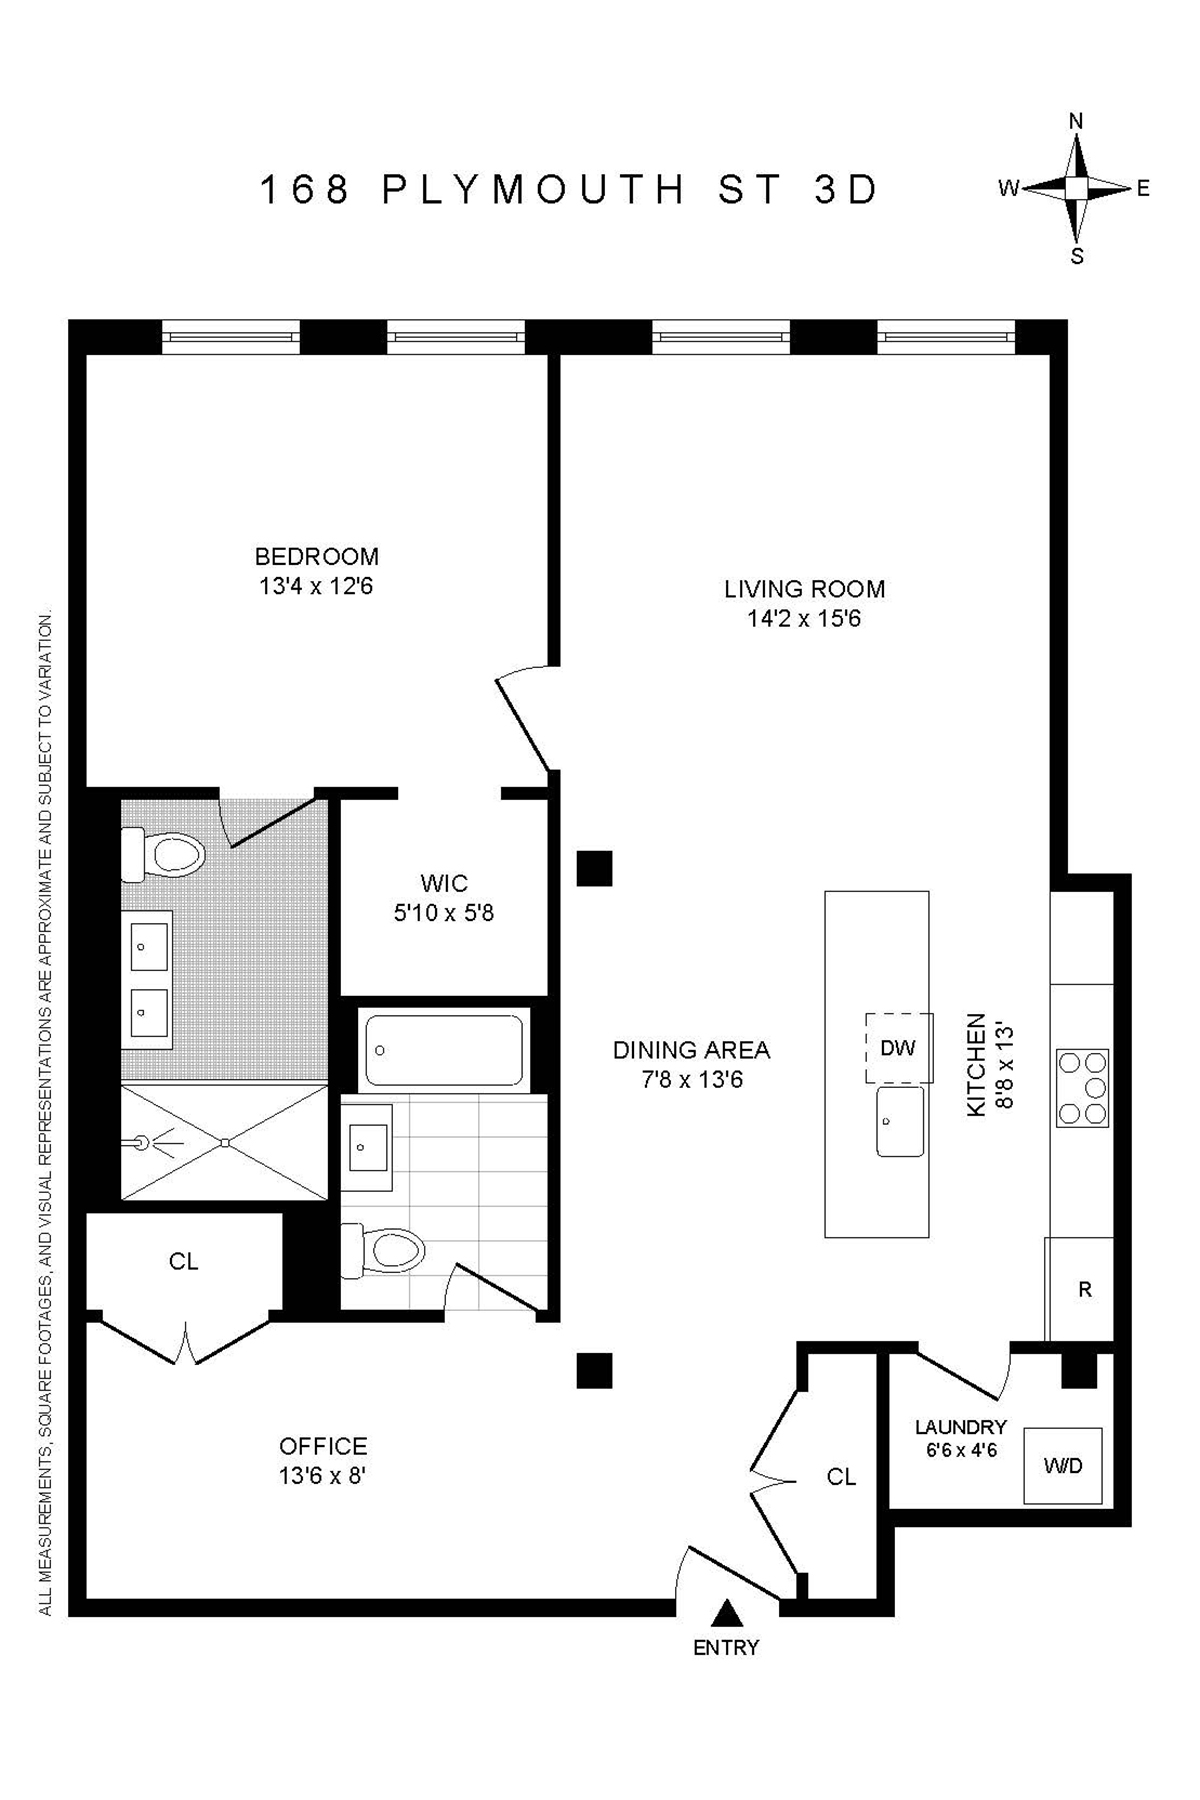
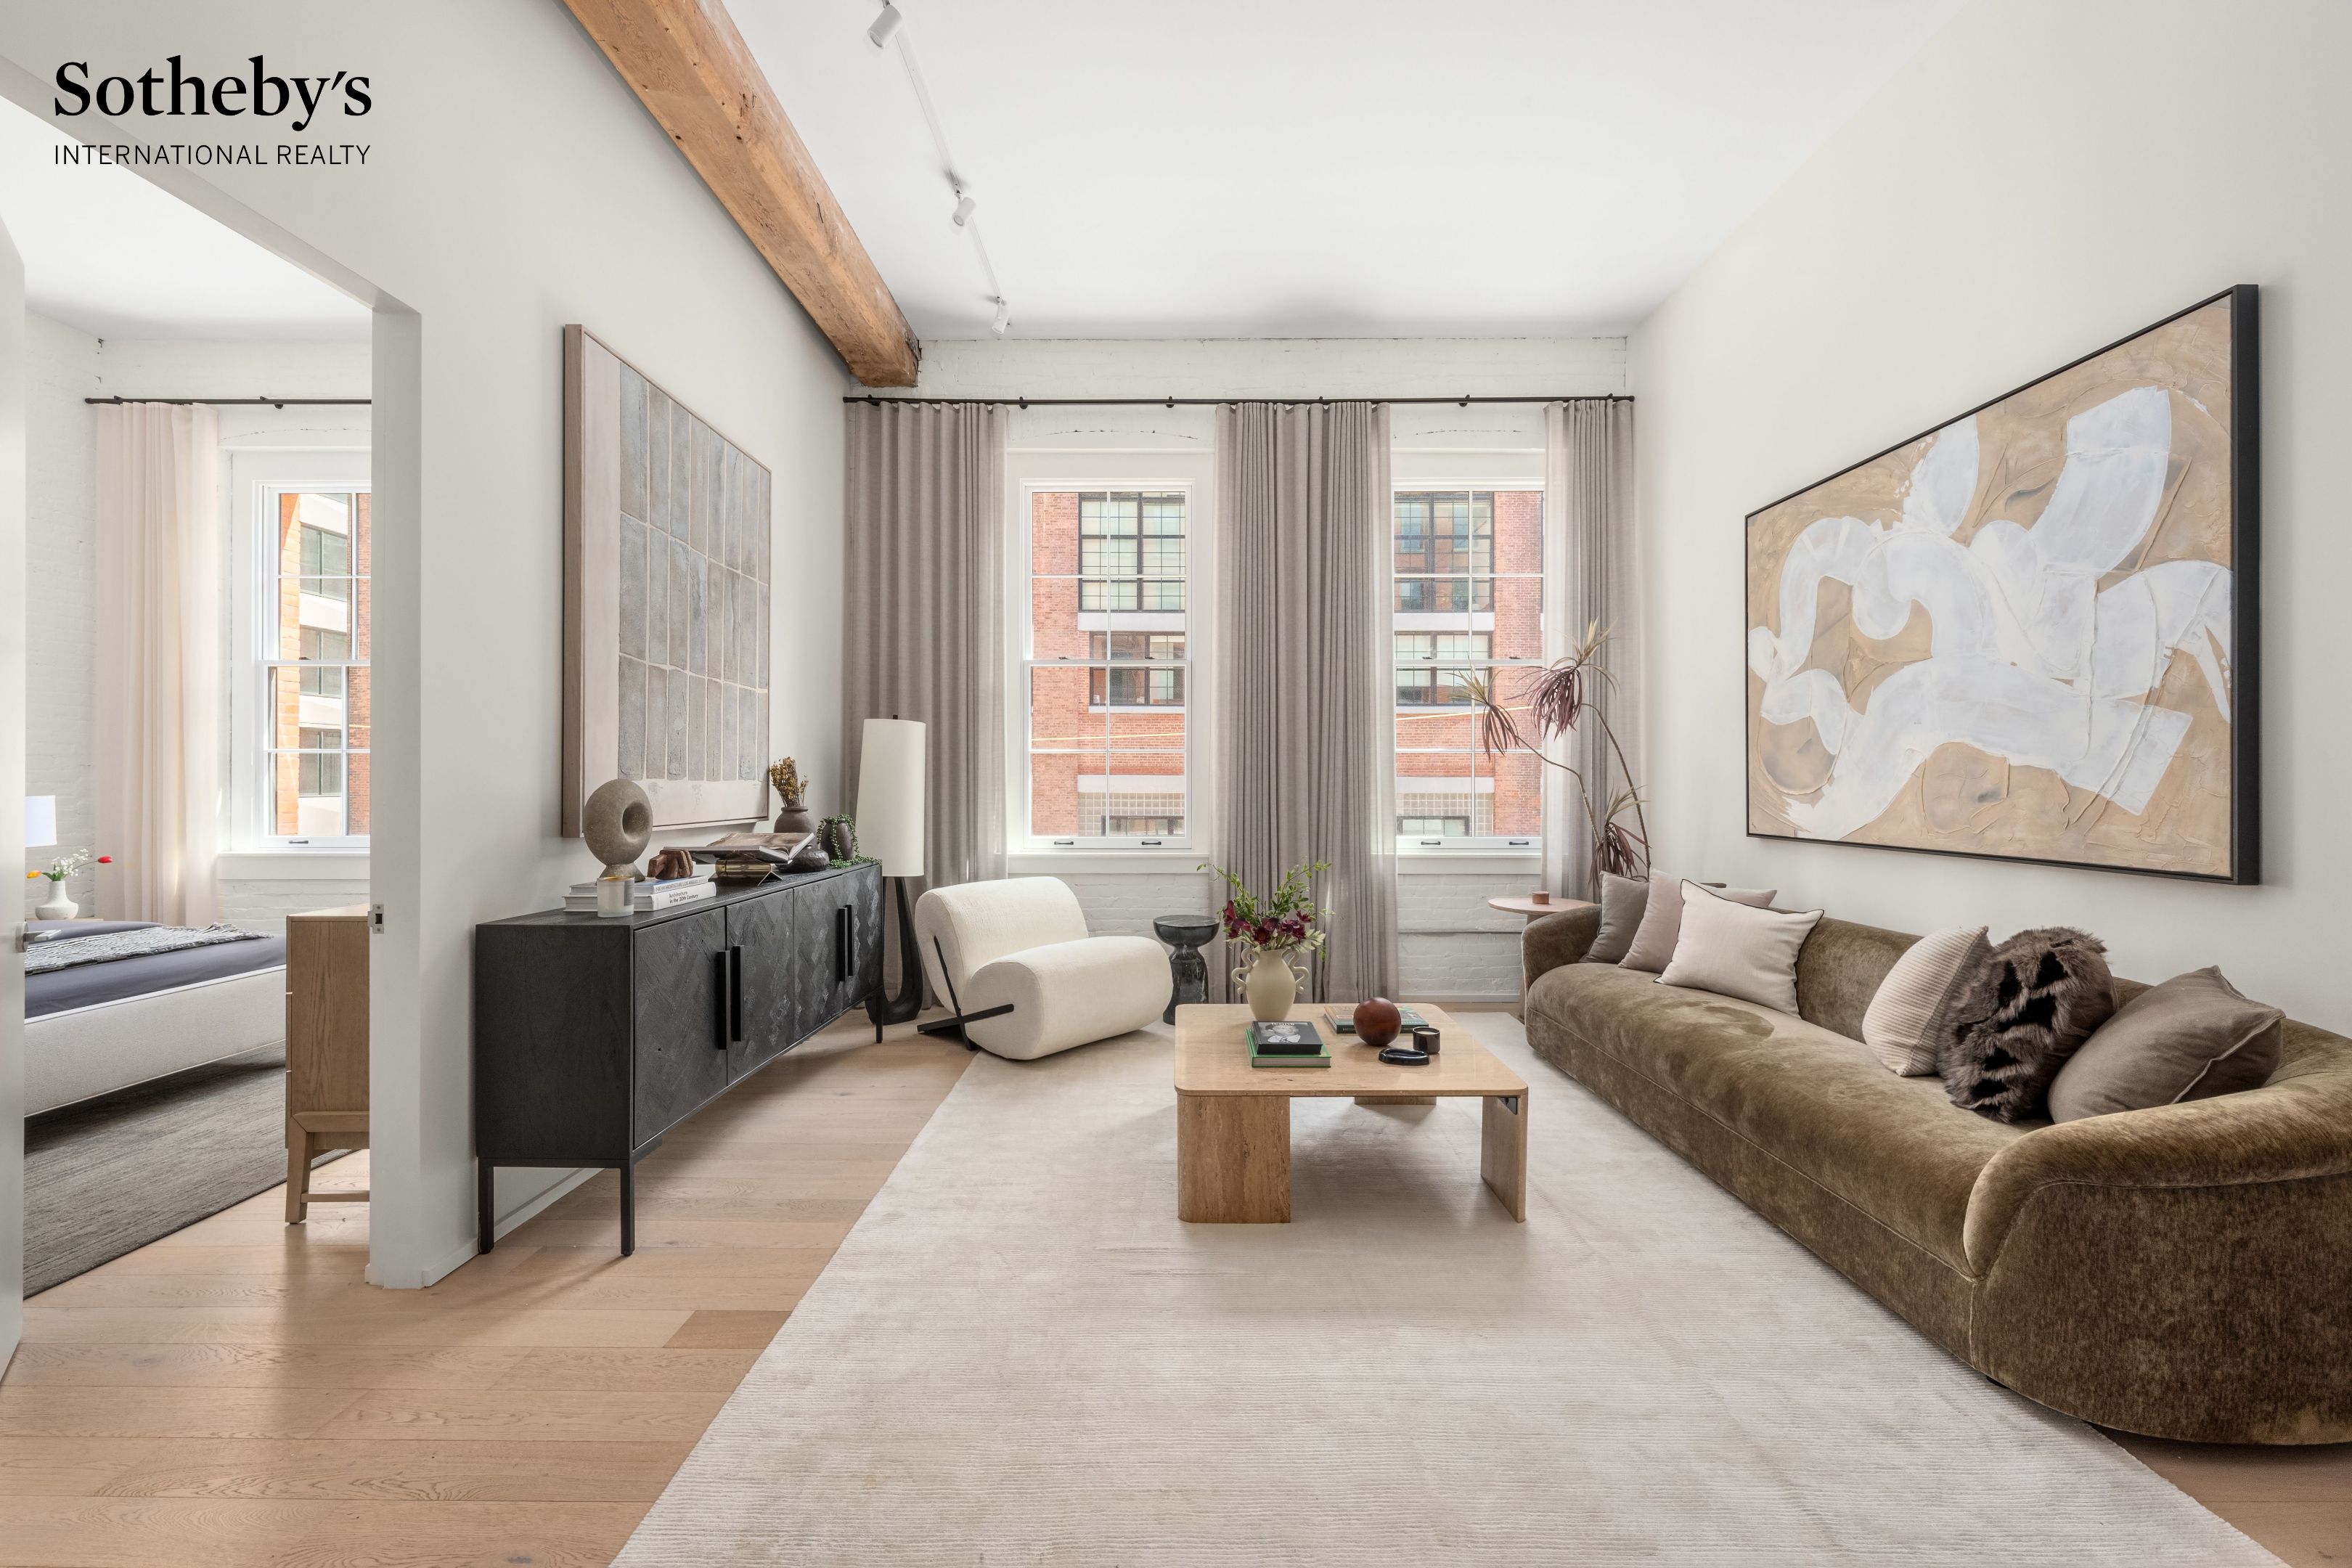
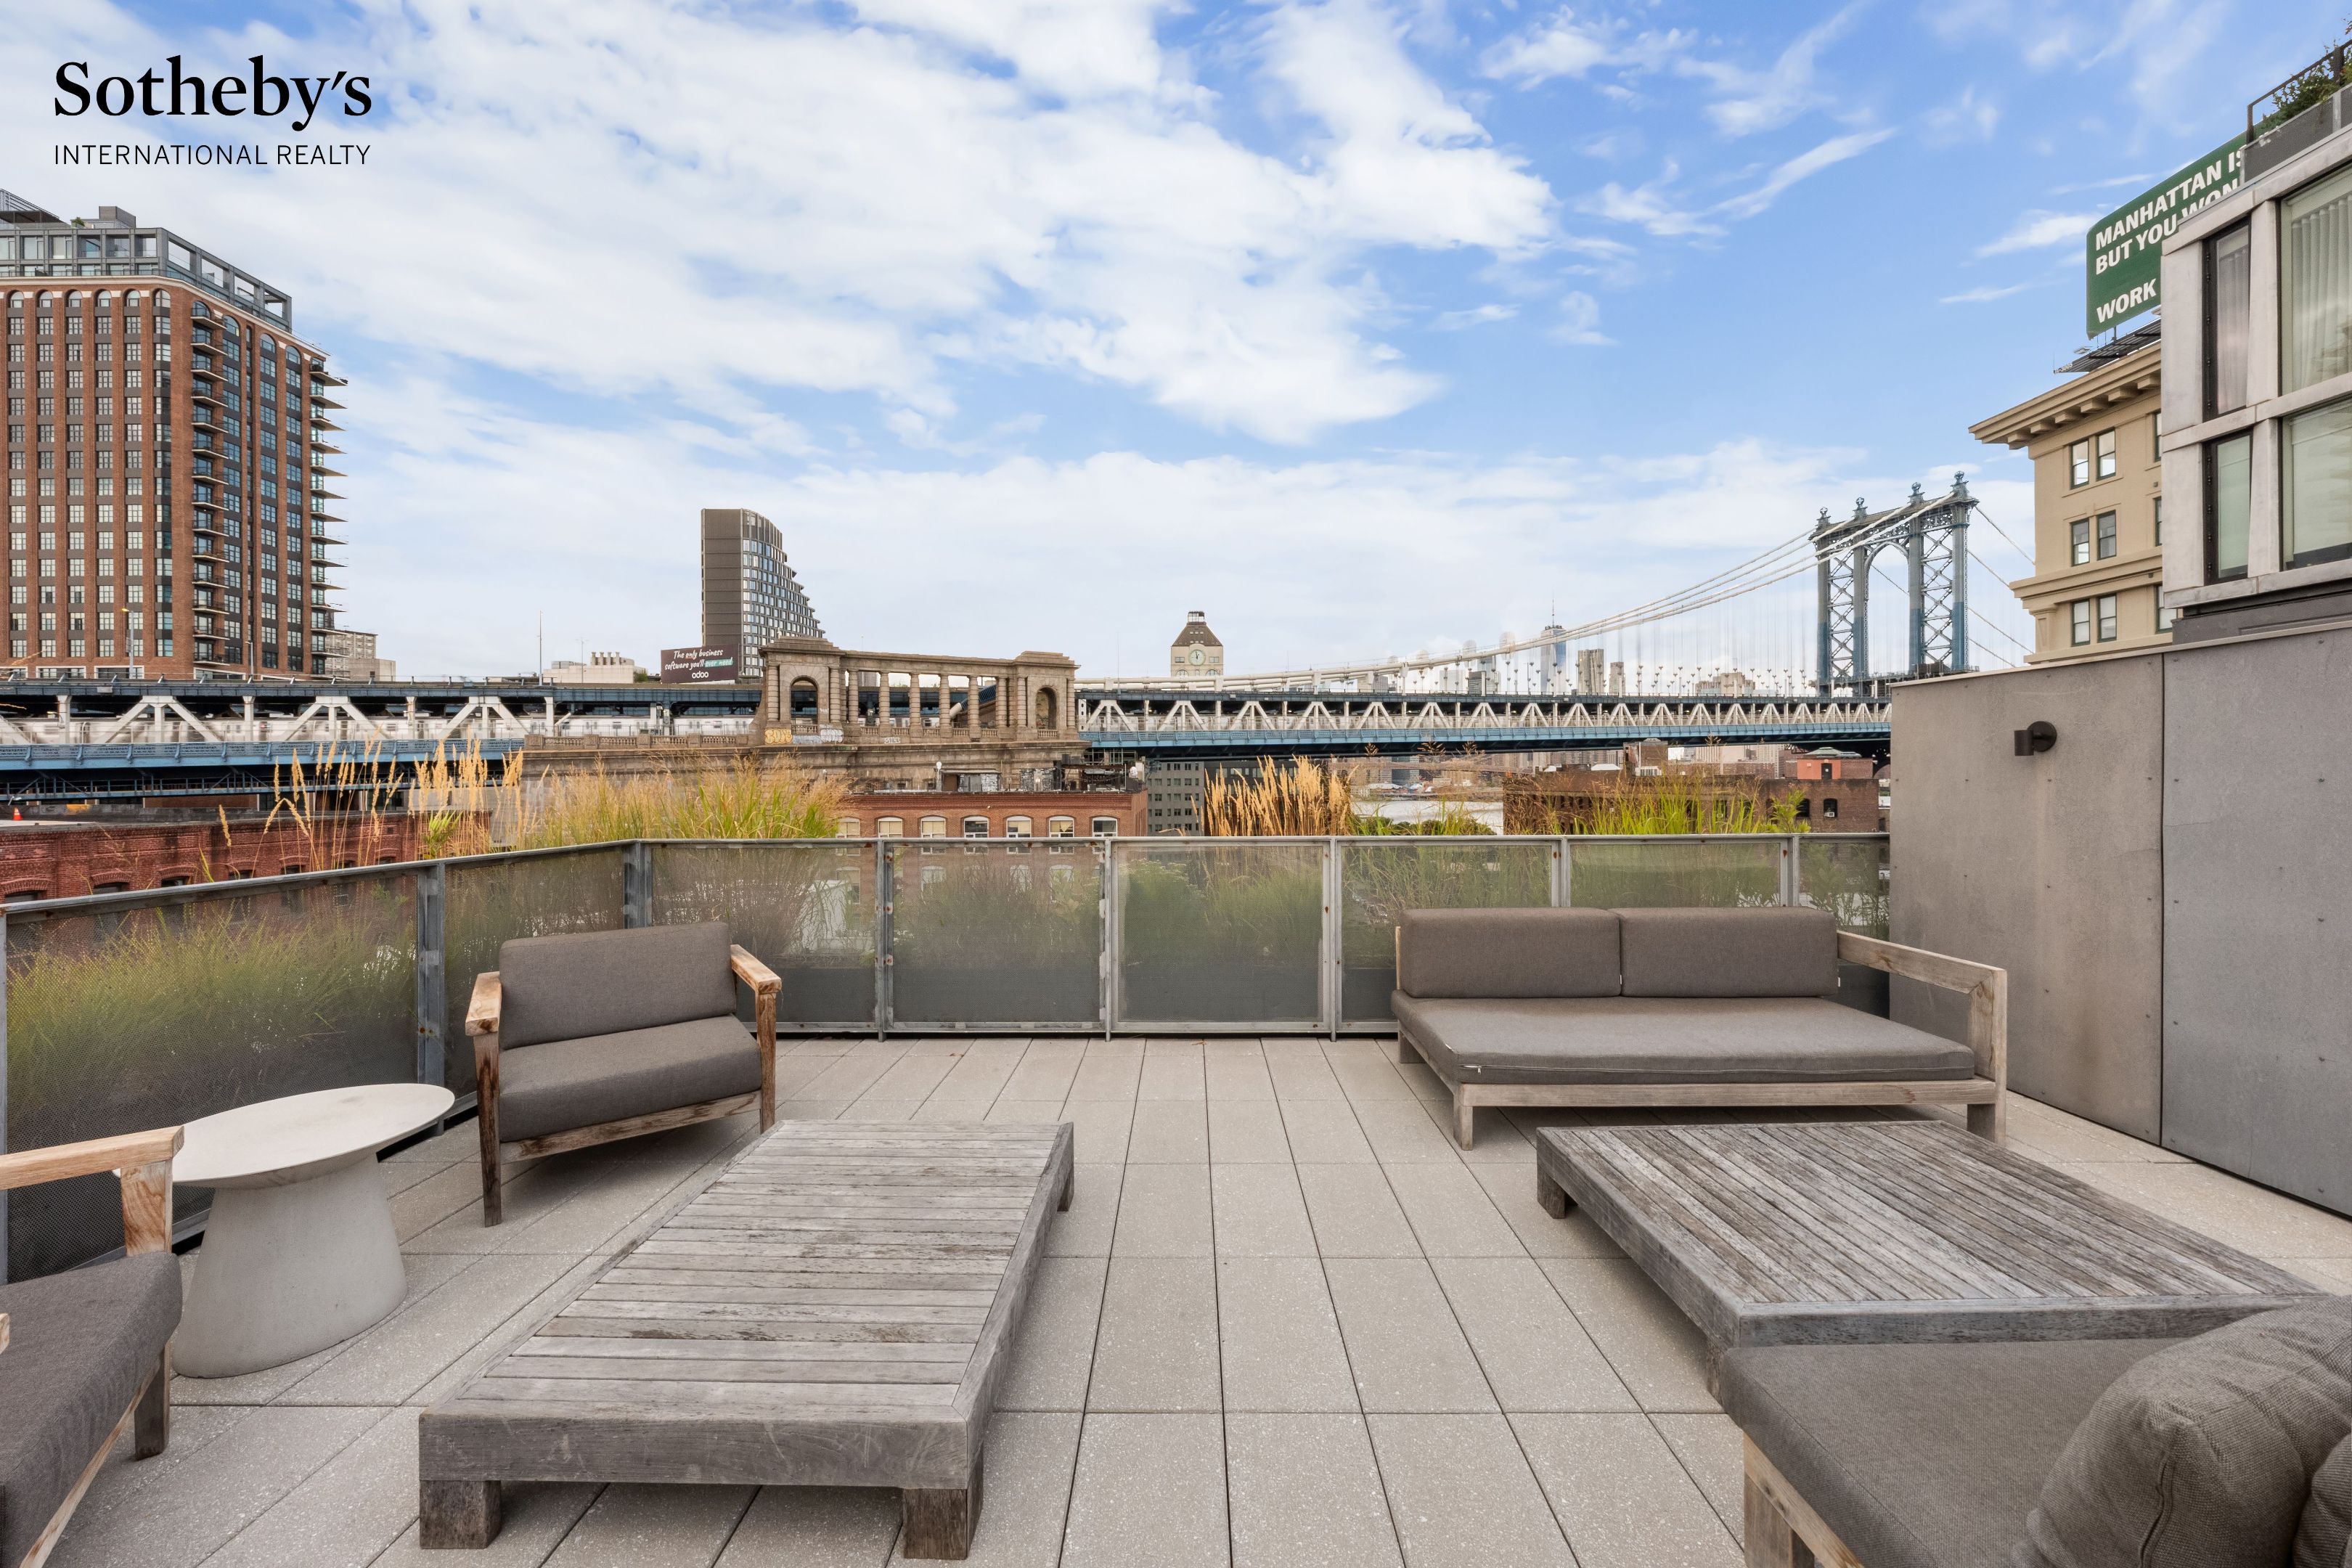
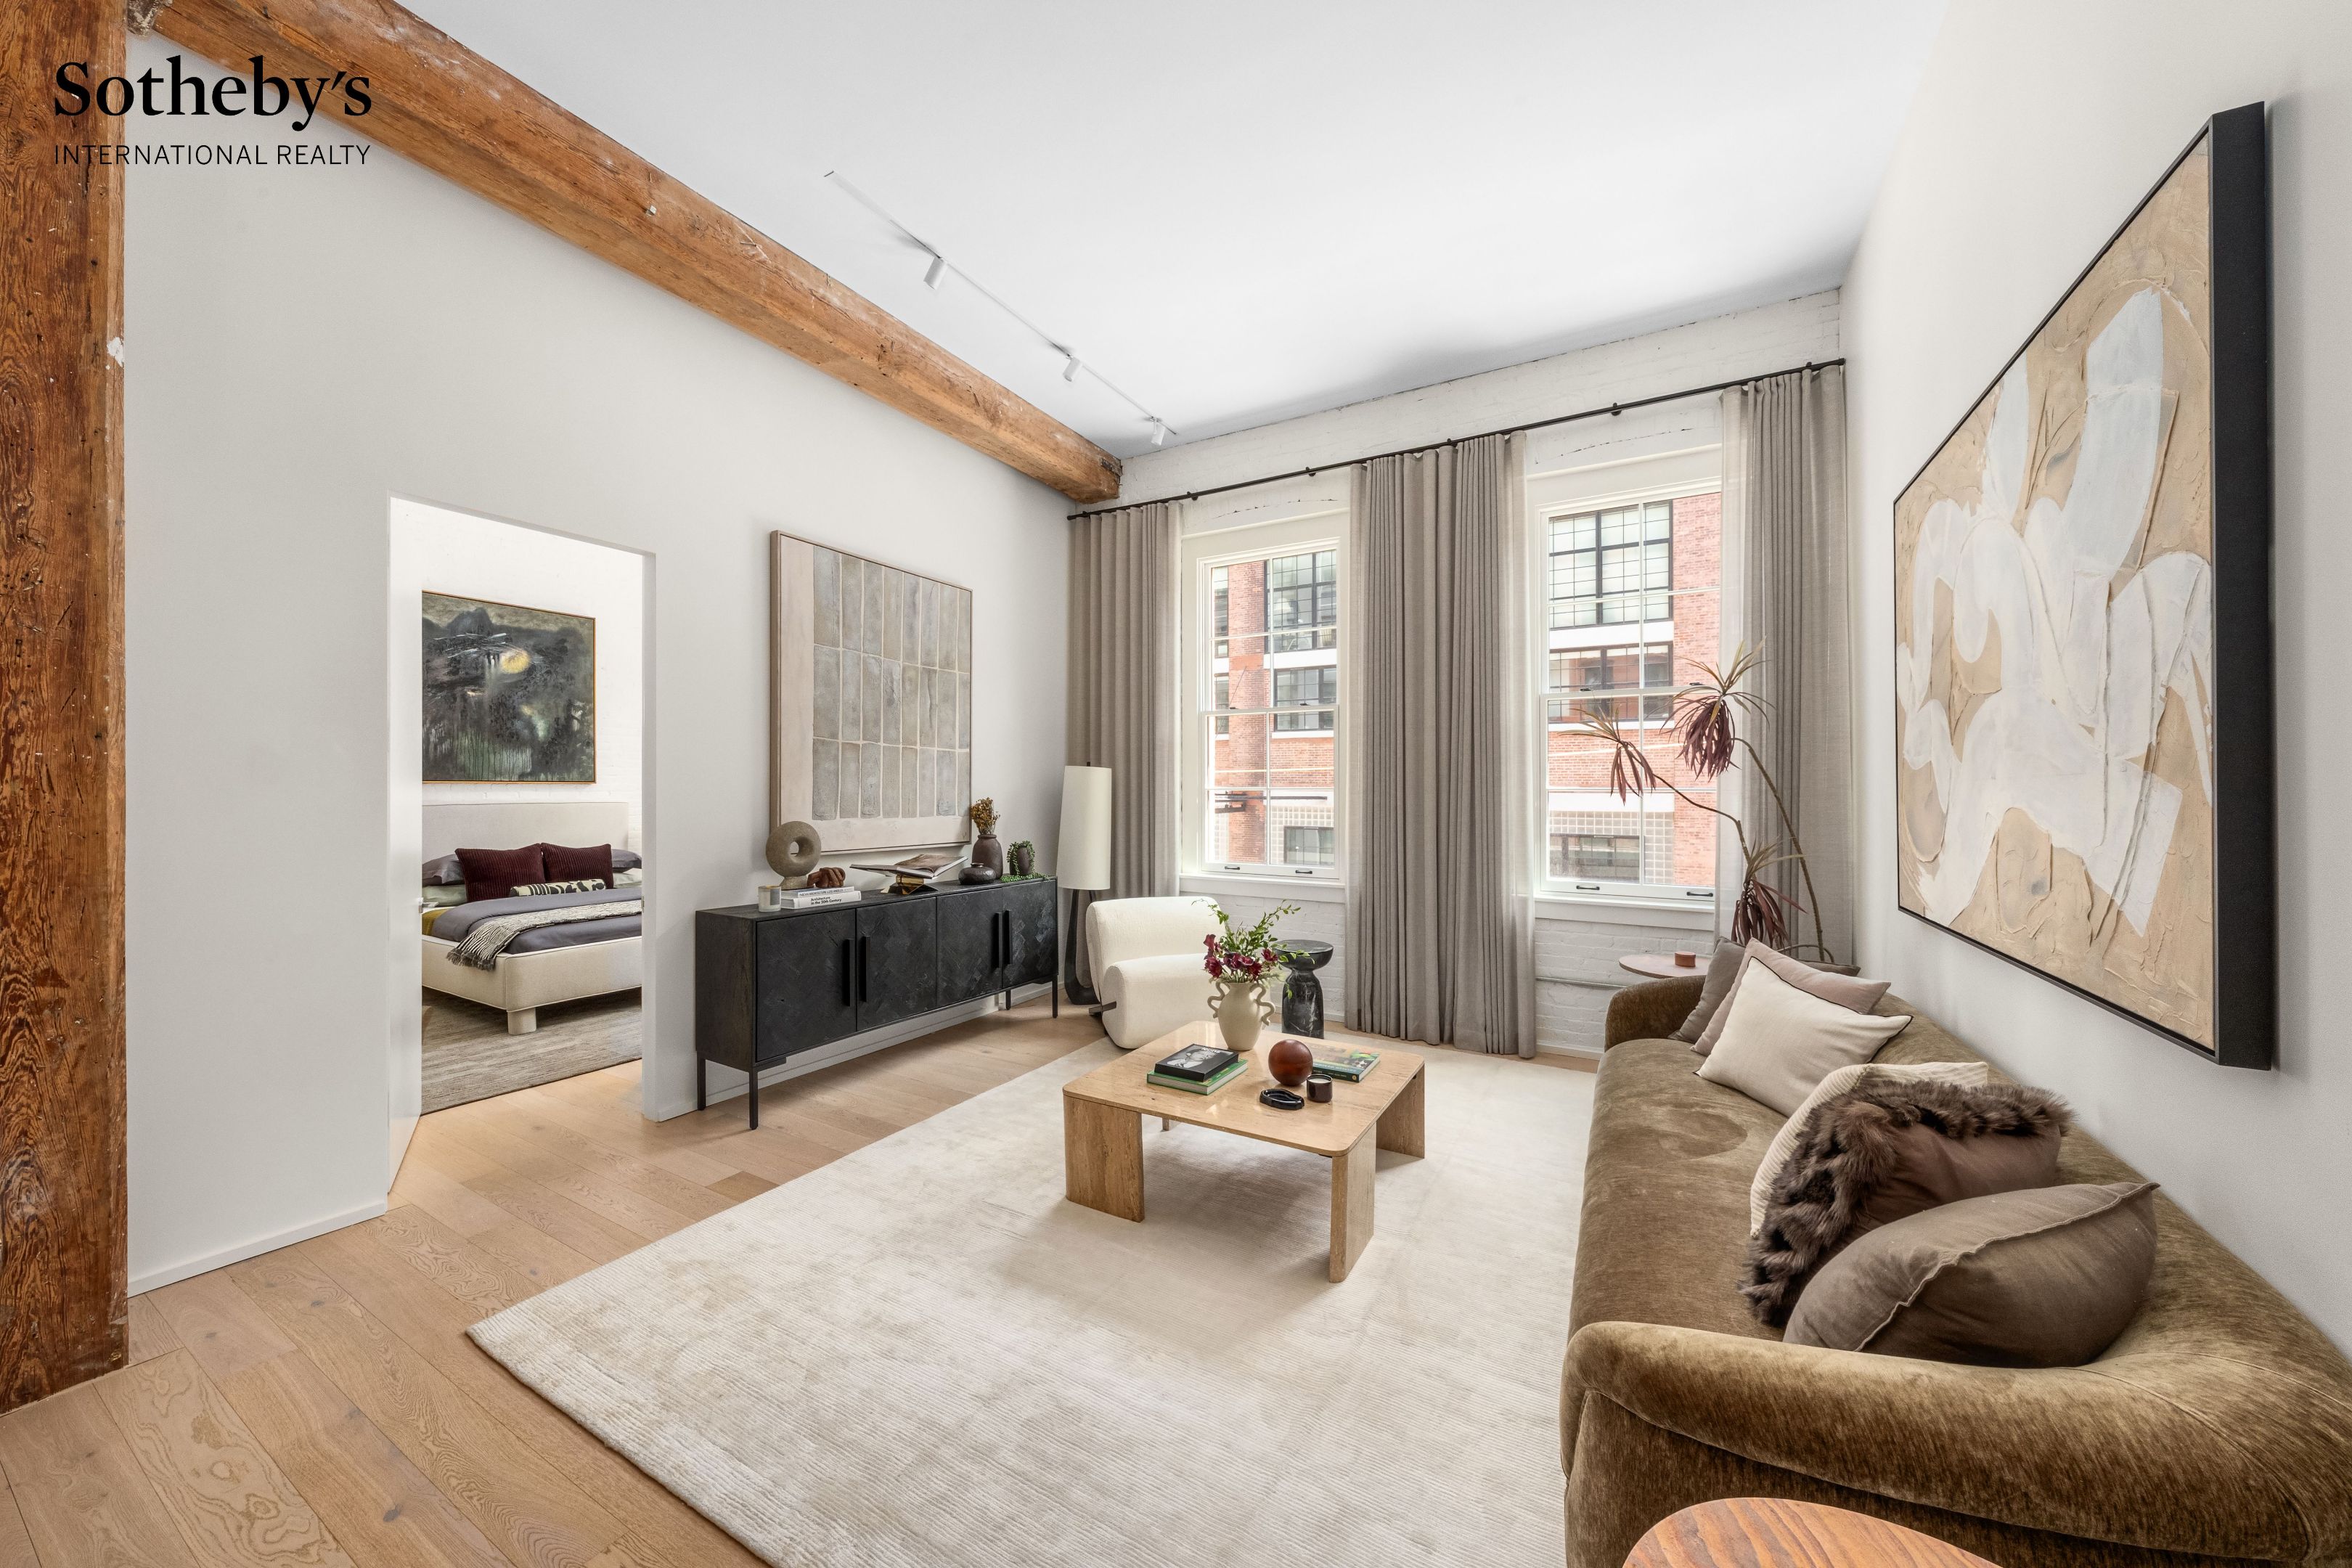
168 Plymouth Street #3D, New York City, NY 11201
Last updated:
The Private Brokerage Advantage
As an independent luxury buyer representative, Régis shares 50% of the buyer-side commission he actually receives on your purchase. Eligible buyers receive that Buyer Commission Share directly at closing to offset closing costs, down payments, or renovations. The figures beside this are illustrative, based on a 3% buyer-broker commission; your share follows the commission offered on the transaction.

Regis Roumila
Verified Member: REBNY · NAR
NYDOS LIC#: 10491211335
Property Overview
Property Details
Residence Features
Estimated Monthly Payment
Estimates only. Actual payments may vary. Confirm terms with your lender.
Sales and market data
Recent sales
35 apartments at The Plymouth Street Condominium have recorded sales since October 2021, the most recent for $2,650,000 in September 2025. Prices are the figures recorded with the City, not asking prices.
| THBApartment | Bedroom count not recorded | 2,067 | $2,650,000 | $1,282/ft² | September 30, 2025City record |
|---|---|---|---|---|---|
| 5FApartment | 1 | 1,371 | $2,125,000 | $1,550/ft² | May 28, 2025City record · MLS |
| 5FApartment | 1 | 1,371 | $2,300,000 | $1,678/ft² | August 1, 2024MLS |
| 4FApartment | 1 | 1,371 | $1,999,000 | $1,458/ft² | May 17, 2024City record · MLS |
| THCDuplex | 2 | 2,484 | $2,990,000 | $1,204/ft² | February 23, 2024City record · MLS |
| 3DApartment | 1 | 1,163 | $2,134,354 | $1,835/ft² | January 26, 2023City record · MLS |
| PHDApartment | 3 | 2,033 | $4,950,740 | $2,435/ft² | January 5, 2023City record · MLS |
| 8CApartment | Bedroom count not recorded | 1,733 | $3,541,084 | $2,043/ft² | October 25, 2022City record |
| 3FApartment | 1 | 1,371 | $2,113,887 | $1,542/ft² | October 13, 2022City record · MLS |
| THAApartment | Bedroom count not recorded | 3,068 | $3,551,468 | $1,158/ft² | May 20, 2022City record |
| THBApartment | Bedroom count not recorded | 2,067 | $2,798,253 | $1,354/ft² | May 17, 2022City record |
| 3EApartment | 2 | 1,771 | $3,195,050 | $1,804/ft² | April 14, 2022City record · MLS |
| 8BApartment | 2 | 1,210 | $2,276,909 | $1,882/ft² | April 6, 2022City record · MLS |
| 5DApartment | Bedroom count not recorded | 1,163 | $2,133,336 | $1,834/ft² | March 24, 2022City record |
| 3AApartment | 2 | 1,504 | $2,626,169 | $1,746/ft² | March 23, 2022City record · MLS |
| 3BApartment | 2 | 1,210 | $2,123,153 | $1,755/ft² | March 15, 2022City record · MLS |
| 4BApartment | 2 | 1,210 | $2,148,609 | $1,776/ft² | February 22, 2022City record · MLS |
| 4GApartment | 2 | 1,491 | $2,714,756 | $1,821/ft² | February 18, 2022City record · MLS |
| GApartment | 3 | 2,331 | $3,454,320 | $1,482/ft² | January 21, 2022City record · MLS |
| 4DLoft | 1 | 1,184 | $2,067,404 | $1,746/ft² | January 21, 2022City record · MLS |
| 5CApartment | 3 | 1,733 | $3,280,793 | $1,893/ft² | January 13, 2022City record · MLS |
| 4AApartment | 2 | 1,504 | $2,677,081 | $1,780/ft² | December 22, 2021City record · MLS |
| 2AApartment | 3 | 1,724 | $2,931,644 | $1,700/ft² | December 20, 2021City record · MLS |
| 2BApartment | 1 | 873 | $1,404,175 | $1,608/ft² | December 9, 2021City record · MLS |
| 3GApartment | 2 | 1,491 | $2,631,260 | $1,765/ft² | December 8, 2021City record · MLS |
| 3CApartment | 3 | 1,733 | $3,029,185 | $1,748/ft² | December 3, 2021City record · MLS |
| 8AApartment | 2 | 1,504 | $2,946,917 | $1,959/ft² | December 2, 2021City record · MLS |
| 2GApartment | Bedroom count not recorded | 2,223 | $3,266,758 | $1,470/ft² | November 29, 2021City record |
| PHALoft | 3 | 3,062 | $6,800,000 | $2,221/ft² | November 19, 2021City record · MLS |
| 7AApartment | 2 | 1,504 | $2,815,000 | $1,872/ft² | November 17, 2021City record · MLS |
| 4CApartment | 3 | 1,733 | $3,135,664 | $1,809/ft² | November 16, 2021City record · MLS |
| 7BApartment | 2 | 1,210 | $2,193,412 | $1,813/ft² | November 12, 2021City record · MLS |
| PHBApartment | 3 | 1,922 | $4,450,000 | $2,315/ft² | November 12, 2021City record · MLS |
| 7CApartment | 3 | 1,733 | $3,352,245 | $1,934/ft² | November 12, 2021City record · MLS |
| PHELoft | 3 | 2,357 | $5,235,529 | $2,221/ft² | November 10, 2021City record · MLS |
Every row is a recorded transaction, including ancillary spaces such as storage and staff rooms where they were sold separately. Those are excluded from the benchmark below.
How this price compares
- This home
- $1,749,000
- Median sold price
- $2,090,646
- Difference
- -$341,646 (-16.3%)
- This home, $/ft²
- $1,504
- Median $/ft²
- $1,579
- Comparable sales
- 6
- Sales from
- Dec 2021 – May 2025
Based on one-bedroom sales at The Plymouth Street Condominium.
More market data
- Middle half of those sales
- $2,016,101 – $2,122,222
How these sales were negotiated
- Sale-to-list price
- 101.7%
- Sold below asking
- 33%
- Typical time to find a buyer
- 502 days
- Typical time to close
- 61 days
Based on one-bedroom sales at The Plymouth Street Condominium with the required listing and closing data. Sample sizes vary by metric.
Price trend
Median sale price, condo and house one-bedroom sales in DUMBO
| Year | Median sold price | Sales |
|---|---|---|
| 2022 | $1,062,500 | 34 |
| 2023 | $1,227,900 | 14 |
| 2024 | $1,240,000 | 13 |
| 2025 | $1,116,946 | 14 |
| 2026 YTD | $979,000 | 11 |
More market history
| Year | Median sold price | Sales |
|---|---|---|
| 2017 | $1,075,000 | 33 |
| 2018 | $1,283,750 | 18 |
| 2019 | $1,043,500 | 18 |
| 2020 | $937,500 | 23 |
| 2021 | $935,000 | 52 |
Based on recorded condo and house one-bedroom sales in DUMBO. 2026 is year-to-date.
Sales data through September 2025.
Sale prices and dates are based on NYC ACRIS records. MLS closing dates may differ. Historical sales are not an appraisal or valuation of this property.
Price and Property History for 168 Plymouth Street, Unit 3D
Review the recorded listing activity for 168 Plymouth Street, Unit 3D, including asking-price changes and prior market dates.
- Last sold (recorded)
- $2,134,354 on January 26, 2023
| Date | Price | Listing event |
|---|---|---|
| $1,749,000 | Listed for sale by Sothebys International Realty | |
| $2,134,354 | Sold — recorded sale price | |
| $2,092,000 | Entered contract | |
| $2,092,000 | Asking price increased by $21,000, or 1% | |
| $2,071,000 | Listed for sale by Sotheby's International Realty, Inc. |
Property Tax History
Taxes at 168 Plymouth Street #3D were $20,969 in 2026, down 10.0% from 2025.
| Year | Tax Assessment | Land | Additions | Billable Value | Property Tax | Tax Rate |
|---|---|---|---|---|---|---|
| 2026FY 2026/27 | $167,755 | $19,823 | $147,932 | $167,755 | $20,969 | 12.5%Estimated |
| 2025FY 2025/26 | $202,114 | $19,823 | $182,291 | $186,321 | $23,290 | 12.5%Estimated |
| 2024FY 2024/25 | $194,679 | $19,823 | $174,856 | $181,495 | $22,687 | 12.5% |
| 2023FY 2023/24 | $178,200 | $19,823 | $158,377 | $178,200 | $22,279 | 12.502% |
| 2022FY 2022/23 | $123,086 | $19,823 | $103,263 | $123,086 | $15,099 | 12.267% |
The City has not published the official FY2026/27 and FY2025/26 tax rates yet. We calculated the tax for those years using the prior year’s rate, so treat them as an estimate rather than a figure the City has adopted. Every rate without the Estimated marker is the published one.
Tax Assessment is the assessed value on the City’s roll, and it is the figure other listing sites publish. It is not what the bill is calculated on. New York phases assessment changes in gradually for some tax classes, so the City bills the Billable Value shown beside it, less any exemption the owner holds. It usually trails the assessment, and it can sit above it for a few years after an assessment falls.
Figures are the New York City Department of Finance assessment roll for tax lot 3000301011. Assessed and billable values are determined by the City for tax purposes and are not an appraisal or an estimate of market value. Tax classes and rates are set annually and can change.
About The Building
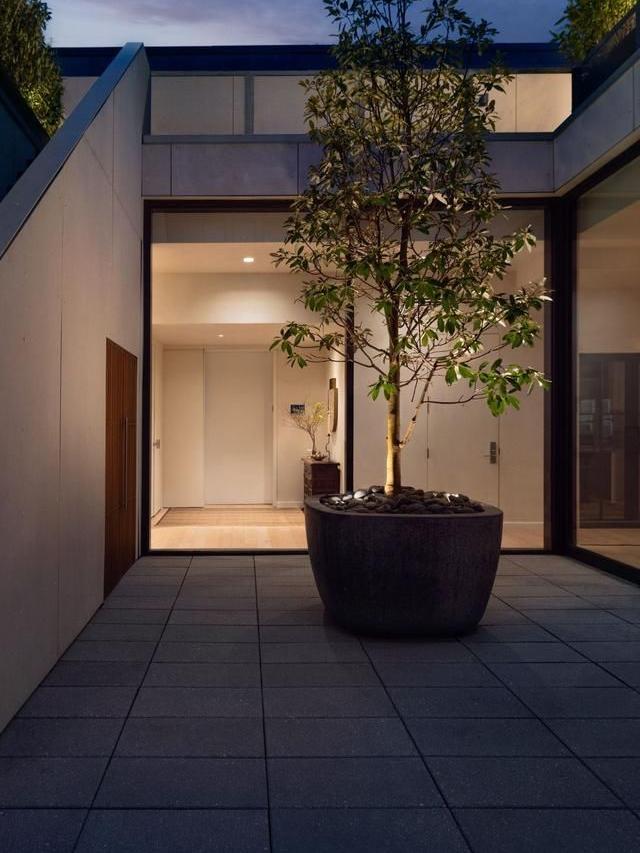
The Plymouth Street Condominium
168 Plymouth Street, Brooklyn, NY 11201
A building in DUMBO / Vinegar Hill, currently featuring 3 active listings.
Interested in The Plymouth Street Condominium?
Consult Régis for private buyer guidance, off-market opportunities, building financials, board package requirements, closing costs, and potential Buyer Savings.
In the Neighborhood
Nearby Schools
* Distances are approximate line-of-sight metrics.
Map
DUMBO
Overview of DUMBO
DUMBO (Down Under the Manhattan Bridge Overpass) is iconic. For buyers seeking DUMBO real estate, it is luxury lofts. Living in DUMBO is cinematic. As a Brooklyn NYC neighborhood, it is tech-forward.Real Estate
Homes for sale in DUMBO are expensive lofts.Lifestyle
The lifestyle is high-end and touristy.Transportation
F/A/C trains and Ferry.Amenities
Brooklyn Bridge Park.Best For
Luxury seekers.
RLS IDX Data display by Real Estate Rebate Team. This information is not verified for authenticity or accuracy and is not guaranteed and may not reflect all real estate activity in the market. ©2026 The Real Estate Board of New York, Inc., All rights reserved. IDX information is provided exclusively for consumers’ personal, non-commercial use and it may not be used for any purpose other than to identify prospective properties consumers may be interested in purchasing.
All information furnished regarding property for sale, rental or financing is from sources deemed reliable, but no warranty or representation is made as to the accuracy thereof and same is submitted subject to errors, omissions, change of price, rental or other conditions, prior sale, lease or financing or withdrawal without notice. All dimensions are approximate. For exact dimensions, you must hire your own architect or engineer and the number of bedrooms listed is for informational purposes and is not a legal conclusion. Please consult with your own architect or engineer for exact dimensions and legal specifications.